Figure and Table: Variable, Fixed, and Total Costs 
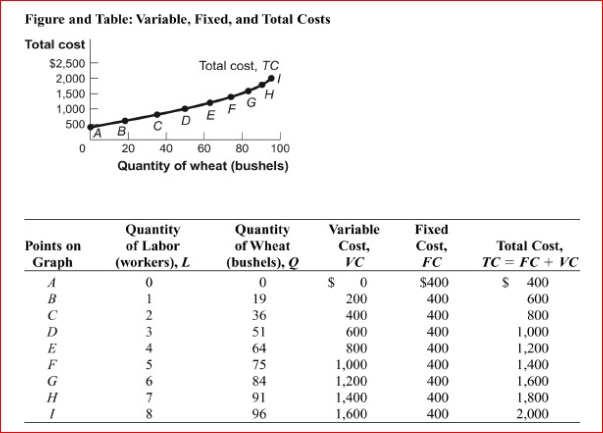 (Figure and Table: Variable, Fixed, and Total Costs) Look at the figure and table Variable, Fixed, and Total Costs.In the figure, when 51 bushels of wheat is produced, the average fixed cost is ,
Average variable cost is ________, and average total cost is _.
A) $7.84; $11.76; $19.60
B) $133.33; $200; $333.33
C) $400; $600; $1,000
D) $5.33; $13.33; $18.67
Correct Answer:
Verified
Q112: Kaile Cakes produces 10 cakes per day.The
Q151: Figure: Short-Run Costs II Q152: (Figure and Table: Variable, Fixed, and Total Q153: Figure: Short-Run Costs II Q154: Figure: Short-Run Costs II Q157: Figure: Short-Run Costs Q158: Figure and Table: Variable, Fixed, and Total Q159: In the short run, as output gets Q160: Cindy operates Birds-R-Us, a small store manufacturing Q161: Unlock this Answer For Free Now! View this answer and more for free by performing one of the following actions Scan the QR code to install the App and get 2 free unlocks Unlock quizzes for free by uploading documents![]()
![]()
(Figure: Short-Run Costs II)![]()
![]()

