Figure: Short-Run Costs II 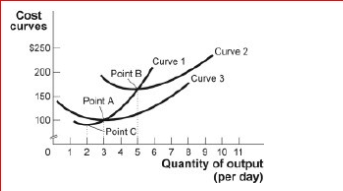
 (Figure: Short-Run Costs II) Look at the figure Short-Run Costs II.Curve 1 crosses the average variable cost curve at:
A) 3 units of output.
B) approximately 5.3 units of output.
C) the minimum value of curve 2.
D) the level of output at which diminishing marginal returns begin.
Correct Answer:
Verified
Q144: Figure: Short-Run Costs II
(Figure: Short-Run Costs II)
Q145: Figure and Table: Variable, Fixed, and Total
Q146: Figure: Short-Run Costs Q147: Figure: Short-Run Costs Q148: Figure: Short-Run Costs Q150: Figure: Short-Run Costs Q151: Figure: Short-Run Costs II Q152: (Figure and Table: Variable, Fixed, and Total Q153: Figure: Short-Run Costs II Q154: Figure: Short-Run Costs II Unlock this Answer For Free Now! View this answer and more for free by performing one of the following actions Scan the QR code to install the App and get 2 free unlocks Unlock quizzes for free by uploading documents![]()
![]()
![]()
![]()
![]()
![]()
(Figure: Short-Run Costs II)

