Figure: Consumer Equilibrium I The figure shows three of Owen's indifference curves for pizza and soda per week.Owen has $180 per month to spend on the two goods, and the price of a pizza is $20 and the price of a soda is
$1) 50. 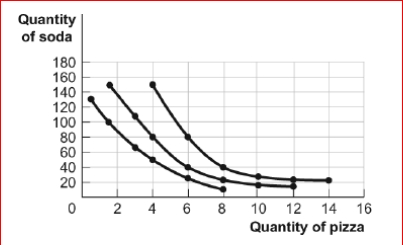
 (Figure: Consumer Equilibrium I) Look at the figure Consumer Equilibrium I.What is Owen's optimal consumption bundle?
A) 4 pizzas and 150 sodas
B) 8 pizzas and 40 sodas
C) 6 pizzas and 40 sodas
D) 14 pizzas and 20 sodas
Correct Answer:
Verified
Q75: Joseph chooses a combination of apples and
Q76: Figure: Consumer Equilibrium I The figure shows
Q77: After learning about indifference curves, Sandy realizes
Q78: Joseph chooses a combination of apples and
Q80: Figure: The Indifference Curve Map II
(Figure: The
Q82: Mr.Black always consumes coffee and cream in
Q211: Luis is consuming his optimal consumption bundle
Q223: Jake considers fries and onion rings perfect
Q225: LaToya sees honey and sugar as perfect
Q227: Mario sees popcorn and pretzels as perfect
Unlock this Answer For Free Now!
View this answer and more for free by performing one of the following actions

Scan the QR code to install the App and get 2 free unlocks

Unlock quizzes for free by uploading documents