Figure: Harold's Indifference Curves The figure shows three of Harold's indifference curves for bread and cheese. 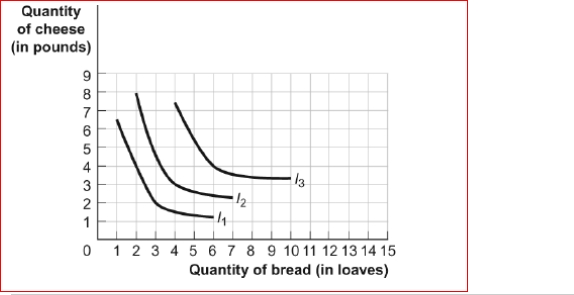 (Figure: Harold's Indifference Curves) Look at the figure Harold's Indifference Curves.If the price of bread is $2 per loaf, the price of cheese is $2, and Harold has $10 to spend on bread and cheese, what is Harold's optimal consumption bundle of bread and cheese?
A) 6 loaves of bread and 4 pounds of cheese
B) 4 loaves of bread and 3 pounds of cheese
C) 3 loaves of bread and 2 pounds of cheese
D) 2 loaves of bread and 8 pounds of cheese
Correct Answer:
Verified
Q134: Figure: The Consumption of Video Games and
Q135: Figure: The Consumption of Video Games and
Q136: Figure: The Optimal Consumption Bundle 
Q137: Figure: Harold's Indifference Curves The figure shows
Q138: Figure: Indifference Curves and Consumption Bundles
Q140: Figure: The Optimal Consumption Bundle
Q141: Figure and Table: The Changing Slope of
Q142: Figure: Consumer Equilibrium III
(Figure: Consumer Equilibrium III)
Q143: Figure: Consumer Equilibrium III Q144: Figure: Consumer Equilibrium II ![]()
![]()
Unlock this Answer For Free Now!
View this answer and more for free by performing one of the following actions

Scan the QR code to install the App and get 2 free unlocks

Unlock quizzes for free by uploading documents