Figure: Consumer Equilibrium II 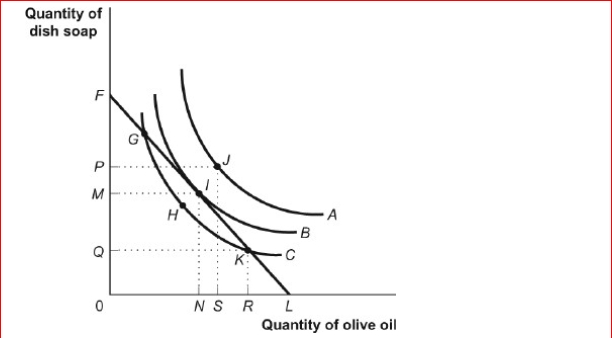
 (Figure: Consumer Equilibrium II) Look at the figure Consumer Equilibrium II.Given the figure, which of the following statements is true?
A) Point I is the point of utility maximization.
B) At the point of utility maximization, the rate at which Ashyra is willing to exchange one good for another is less than the rate at which the goods can be exchanged in the market.
C) At point I, Py.= Px
D) At point I, Ashyra has some income left for saving.
Correct Answer:
Verified
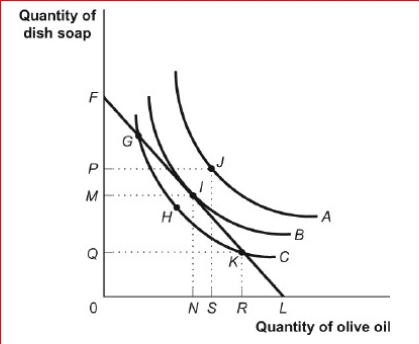
Q142: Figure: Consumer Equilibrium III
(Figure: Consumer Equilibrium III)
Q143: Figure: Consumer Equilibrium III Q144: Figure: Consumer Equilibrium II Q145: Figure: Consumer Equilibrium III Q146: Figure: Consumer Equilibrium II Q148: Figure: Consumer Equilibrium II Q149: Figure: Consumer Equilibrium III Q150: Figure: Consumer Equilibrium III Q151: Figure: Consumer Equilibrium III Q152: Figure and Table: The Changing Slope of Unlock this Answer For Free Now! View this answer and more for free by performing one of the following actions Scan the QR code to install the App and get 2 free unlocks Unlock quizzes for free by uploading documents![]()
![]()
![]()
(Figure: Consumer Equilibrium II)![]()
![]()
(Figure: Consumer Equilibrium III)![]()

