Figure: Tom's Production Possibilities
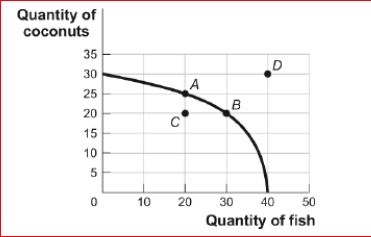
 (Figure: Tom's Production Possibilities) Look at the figure Tom's Production Possibilities.In the figure, the opportunity cost for Tom to move from point C on the curve to point A is:
A.10 coconuts.
B.30 fish.
C.5 coconuts.
D.There is no opportunity cost in terms of fish.
Correct Answer:
Verified
View Answer
Unlock this answer now
Get Access to more Verified Answers free of charge
Q42: Figure: Tom's Production Possibilities
(Figure: Tom's Production Possibilities)
Q43: Figure: Tom's Production Possibilities
(Figure: Tom's Production Possibilities)
Q44: If the production possibility frontier is a
Q45: The effect of a tremendous natural disaster
Unlock this Answer For Free Now!
View this answer and more for free by performing one of the following actions

Scan the QR code to install the App and get 2 free unlocks

Unlock quizzes for free by uploading documents