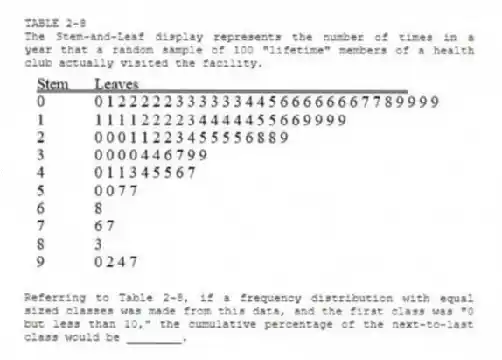
TABLE 2-8
The Stem-and-Leaf display represents the number of times in a year that a random sample of 100 "lifetime" members of a health club actually visited the facility.
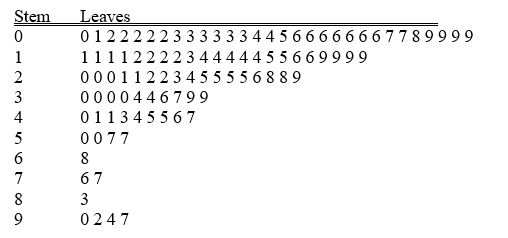
-Referring to Table 2-8, if a frequency distribution with equal sized classes was made from this data, and the first class was "0 but less than 10," the cumulative percentage of the next-to-last class would be ________.
Correct Answer:
Verified
View Answer
Unlock this answer now
Get Access to more Verified Answers free of charge
Q59: TABLE 2-7
The Stem-and-Leaf display below contains data
Q60: You have collected data on the number
Q61: TABLE 2-9
The frequency distribution below represents the
Q62: TABLE 2-8
The Stem-and-Leaf display represents the number
Q63: TABLE 2-7
The Stem-and-Leaf display below contains data
Q65: TABLE 2-9
The frequency distribution below represents the
Q66: TABLE 2-7
The Stem-and-Leaf display below contains data
Q67: TABLE 2-8
The Stem-and-Leaf display represents the number
Q68: TABLE 2-10
The histogram below represents scores achieved
Q69: TABLE 2-8
The Stem-and-Leaf display represents the number
Unlock this Answer For Free Now!
View this answer and more for free by performing one of the following actions

Scan the QR code to install the App and get 2 free unlocks

Unlock quizzes for free by uploading documents