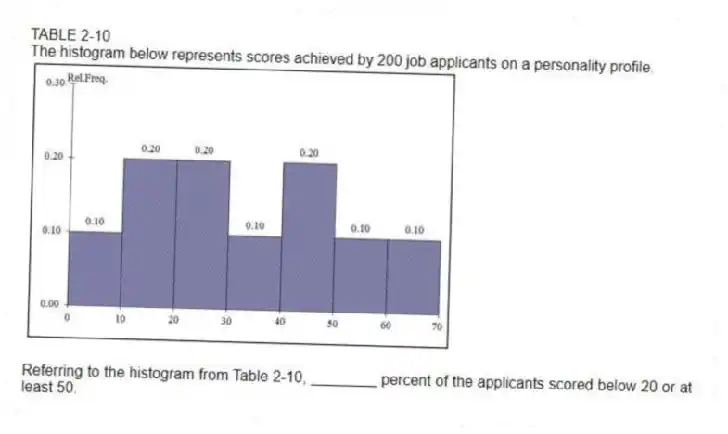
TABLE 2-10
The histogram below represents scores achieved by 200 job applicants on a personality profile.

-Referring to the histogram from Table 2-10, ________ percent of the applicants scored below 20 or at least 50.
Correct Answer:
Verified
Q82: The point halfway between the boundaries of
Q92: The width of each class grouping or
Q93: TABLE 2-11
The ordered array below resulted from
Q94: TABLE 2-11
The ordered array below resulted from
Q95: TABLE 2-11
The ordered array below resulted from
Q98: TABLE 2-10
The histogram below represents scores achieved
Q99: In order to compare one large set
Q99: TABLE 2-11
The ordered array below resulted from
Q101: The main principle behind the Pareto chart
Q103: Histograms are used for numerical data while
Unlock this Answer For Free Now!
View this answer and more for free by performing one of the following actions

Scan the QR code to install the App and get 2 free unlocks

Unlock quizzes for free by uploading documents