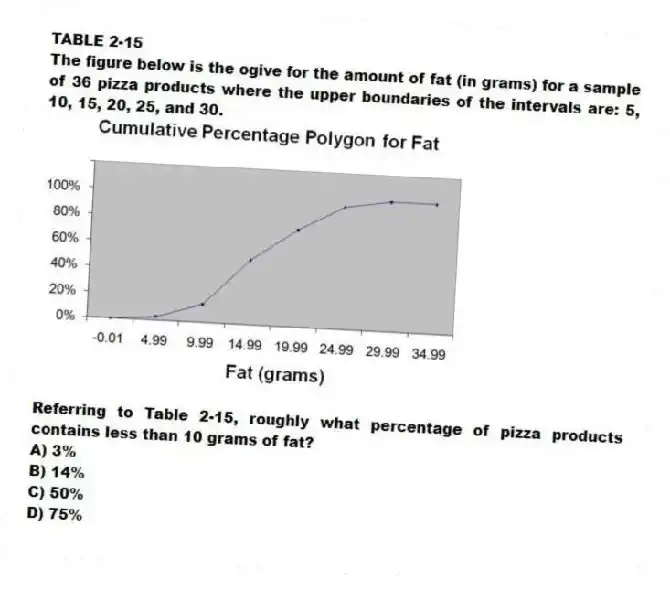
TABLE 2-15
The figure below is the ogive for the amount of fat (in grams) for a sample of 36 pizza products where the upper boundaries of the intervals are: 5, 10, 15, 20, 25, and 30.
-Referring to Table 2-15, roughly what percentage of pizza products contains less than 10 grams of fat?
A) 3%
B) 14%
C) 50%
D) 75%
Correct Answer:
Verified
Q195: TABLE 2-16
The figure below is the percentage
Q196: TABLE 2-14
The table below contains the number
Q197: TABLE 2-18
The stem-and-leaf display below shows the
Q198: TABLE 2-18
The stem-and-leaf display below shows the
Q199: TABLE 2-18
The stem-and-leaf display below shows the
Q201: TABLE 2-18
The stem-and-leaf display below shows the
Q202: Given below is the scatter plot of
Q203: Given below is the scatter plot of
Q204: Given below is the scatter plot of
Q205: TABLE 2-18
The stem-and-leaf display below shows the
Unlock this Answer For Free Now!
View this answer and more for free by performing one of the following actions

Scan the QR code to install the App and get 2 free unlocks

Unlock quizzes for free by uploading documents