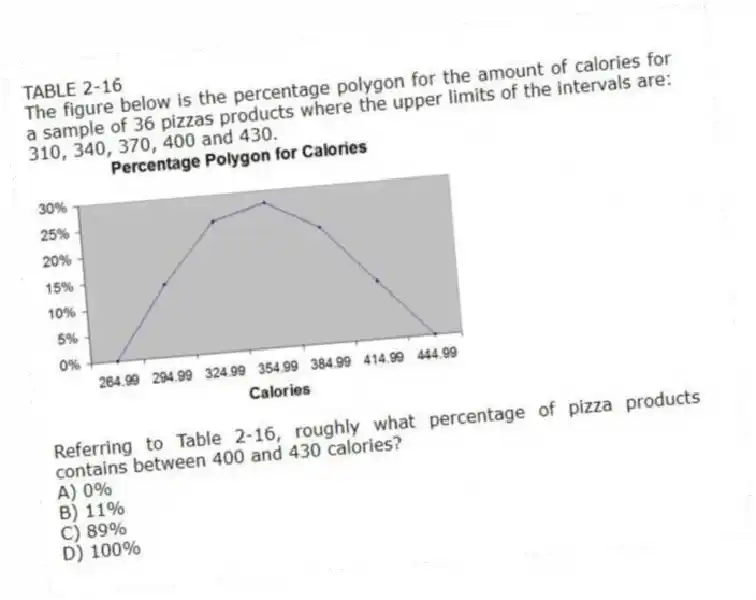
TABLE 2-16
The figure below is the percentage polygon for the amount of calories for a sample of 36 pizzas products where the upper limits of the intervals are: 310, 340, 370, 400 and 430.
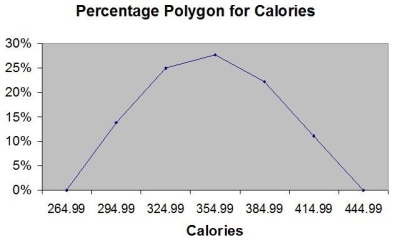
-Referring to Table 2-16, roughly what percentage of pizza products contains between 400 and 430 calories?
A) 0%
B) 11%
C) 89%
D) 100%
Correct Answer:
Verified
Q189: TABLE 2-14
The table below contains the number
Q190: TABLE 2-15
The figure below is the ogive
Q191: TABLE 2-17
The following table presents total retail
Q192: TABLE 2-14
The table below contains the number
Q193: TABLE 2-14
The table below contains the number
Q195: TABLE 2-16
The figure below is the percentage
Q196: TABLE 2-14
The table below contains the number
Q197: TABLE 2-18
The stem-and-leaf display below shows the
Q198: TABLE 2-18
The stem-and-leaf display below shows the
Q199: TABLE 2-18
The stem-and-leaf display below shows the
Unlock this Answer For Free Now!
View this answer and more for free by performing one of the following actions

Scan the QR code to install the App and get 2 free unlocks

Unlock quizzes for free by uploading documents