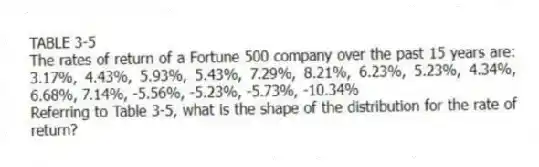
TABLE 3-5
The rates of return of a Fortune 500 company over the past 15 years are: 3.17%, 4.43%, 5.93%, 5.43%, 7.29%, 8.21%, 6.23%, 5.23%, 4.34%, 6.68%, 7.14%, -5.56%, -5.23%, -5.73%, -10.34%
-Referring to Table 3-5, what is the shape of the distribution for the rate of return?
Correct Answer:
Verified
Q114: You were told that the 1ˢᵗ, 2ⁿᵈ
Q116: TABLE 3-6
The rates of return of an
Q117: TABLE 3-6
The rates of return of an
Q120: TABLE 3-6
The rates of return of an
Q121: TABLE 3-7
In a recent academic year, many
Q122: TABLE 3-9
The following table represents the assets
Q123: TABLE 3-11
Given below are the closing prices
Q124: TABLE 3-7
In a recent academic year, many
Q129: The Z score of a value can
Q139: The Z scores can be used to
Unlock this Answer For Free Now!
View this answer and more for free by performing one of the following actions

Scan the QR code to install the App and get 2 free unlocks

Unlock quizzes for free by uploading documents