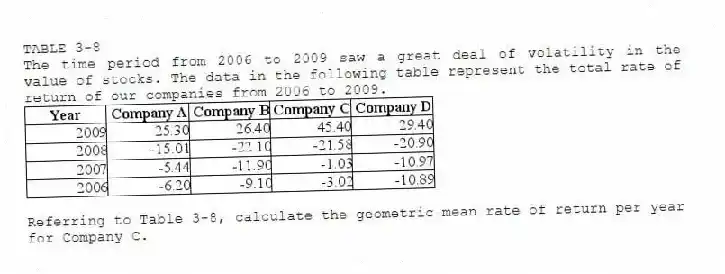
TABLE 3-8
The time period from 2006 to 2009 saw a great deal of volatility in the value of stocks. The data in the following table represent the total rate of return of our companies from 2006 to 2009.
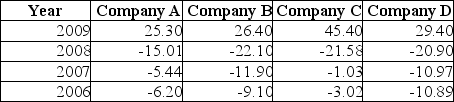
-Referring to Table 3-8, calculate the geometric mean rate of return per year for Company C.
Correct Answer:
Verified
Q135: TABLE 3-7
In a recent academic year, many
Q136: TABLE 3-8
The time period from 2006 to
Q137: TABLE 3-8
The time period from 2006 to
Q138: TABLE 3-11
Given below are the closing prices
Q139: TABLE 3-10
The population of eight analysts at
Q141: TABLE 3-11
Given below are the closing prices
Q142: TABLE 3-12
Given below are the rating and
Q143: TABLE 3-12
Given below are the rating and
Q144: TABLE 3-13
Energy drink consumption has continued to
Q145: TABLE 3-13
Energy drink consumption has continued to
Unlock this Answer For Free Now!
View this answer and more for free by performing one of the following actions

Scan the QR code to install the App and get 2 free unlocks

Unlock quizzes for free by uploading documents