
TABLE 3-8
The time period from 2006 to 2009 saw a great deal of volatility in the value of stocks. The data in the following table represent the total rate of return of our companies from 2006 to 2009.
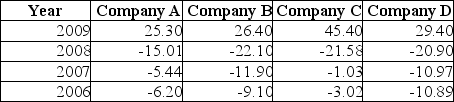
-Referring to Table 3-8, calculate the geometric mean rate of return per year for Company D.
Correct Answer:
Verified
Q121: TABLE 3-7
In a recent academic year, many
Q122: TABLE 3-9
The following table represents the assets
Q123: TABLE 3-11
Given below are the closing prices
Q124: TABLE 3-7
In a recent academic year, many
Q125: The 12-month rate of returns over a
Q126: The rate of return for a stock
Q128: TABLE 3-7
In a recent academic year, many
Q129: TABLE 3-10
The population of eight analysts at
Q130: TABLE 3-7
In a recent academic year, many
Q137: The rate of return for the S&P
Unlock this Answer For Free Now!
View this answer and more for free by performing one of the following actions

Scan the QR code to install the App and get 2 free unlocks

Unlock quizzes for free by uploading documents