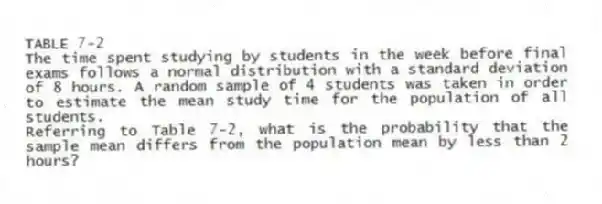
TABLE 7-2
The time spent studying by students in the week before final exams follows a normal distribution with a standard deviation of 8 hours. A random sample of 4 students was taken in order to estimate the mean study time for the population of all students.
-Referring to Table 7-2, what is the probability that the sample mean differs from the population mean by less than 2 hours?
Correct Answer:
Verified
View Answer
Unlock this answer now
Get Access to more Verified Answers free of charge
Q108: A study at a college in the
Q116: A study at a college in the
Q167: TABLE 7-5
According to a survey, only 15%
Q168: TABLE 7-3
The mean selling price of new
Q171: TABLE 7-4
The lifetimes of a certain brand
Q173: TABLE 7-5
According to a survey, only 15%
Q174: TABLE 7-3
The mean selling price of new
Q175: TABLE 7-3
The mean selling price of new
Q176: TABLE 7-5
According to a survey, only 15%
Q177: TABLE 7-5
According to a survey, only 15%
Unlock this Answer For Free Now!
View this answer and more for free by performing one of the following actions

Scan the QR code to install the App and get 2 free unlocks

Unlock quizzes for free by uploading documents