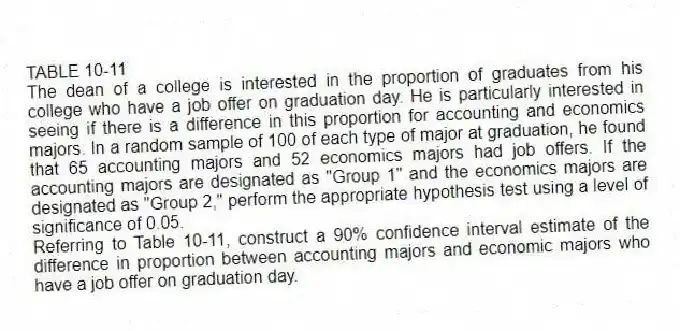
TABLE 10-11
The dean of a college is interested in the proportion of graduates from his college who have a job offer on graduation day. He is particularly interested in seeing if there is a difference in this proportion for accounting and economics majors. In a random sample of 100 of each type of major at graduation, he found that 65 accounting majors and 52 economics majors had job offers. If the accounting majors are designated as "Group 1" and the economics majors are designated as "Group 2," perform the appropriate hypothesis test using a level of significance of 0.05.
-Referring to Table 10-11, construct a 90% confidence interval estimate of the difference in proportion between accounting majors and economic majors who have a job offer on graduation day.
Correct Answer:
Verified
Q147: TABLE 10-11
The dean of a college is
Q148: TABLE 10-12
A quality control engineer is in
Q149: TABLE 10-11
The dean of a college is
Q150: TABLE 10-12
A quality control engineer is in
Q151: TABLE 10-12
A quality control engineer is in
Q153: TABLE 10-12
A quality control engineer is in
Q154: TABLE 10-12
A quality control engineer is in
Q155: TABLE 10-12
A quality control engineer is in
Q156: TABLE 10-12
A quality control engineer is in
Q157: TABLE 10-12
A quality control engineer is in
Unlock this Answer For Free Now!
View this answer and more for free by performing one of the following actions

Scan the QR code to install the App and get 2 free unlocks

Unlock quizzes for free by uploading documents