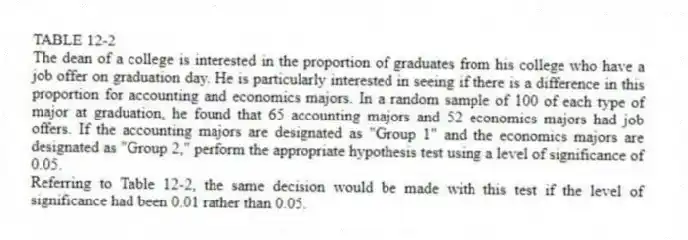
TABLE 12-2
The dean of a college is interested in the proportion of graduates from his college who have a job offer on graduation day. He is particularly interested in seeing if there is a difference in this proportion for accounting and economics majors. In a random sample of 100 of each type of major at graduation, he found that 65 accounting majors and 52 economics majors had job offers. If the accounting majors are designated as "Group 1" and the economics majors are designated as "Group 2," perform the appropriate hypothesis test using a level of significance of 0.05.
-Referring to Table 12-2, the same decision would be made with this test if the level of significance had been 0.01 rather than 0.05.
Correct Answer:
Verified
Q2: A test for the difference between two
Q4: TABLE 12-1
A corporation randomly selects 150 salespeople
Q5: TABLE 12-1
A corporation randomly selects 150 salespeople
Q7: TABLE 12-1
A corporation randomly selects 150 salespeople
Q8: If we wish to determine whether there
Q11: TABLE 12-2
The dean of a college is
Q12: In testing the difference between two proportions
Q12: If we use the X² method of
Q13: TABLE 12-2
The dean of a college is
Q14: In testing a hypothesis using the X²
Unlock this Answer For Free Now!
View this answer and more for free by performing one of the following actions

Scan the QR code to install the App and get 2 free unlocks

Unlock quizzes for free by uploading documents