TABLE 14-3
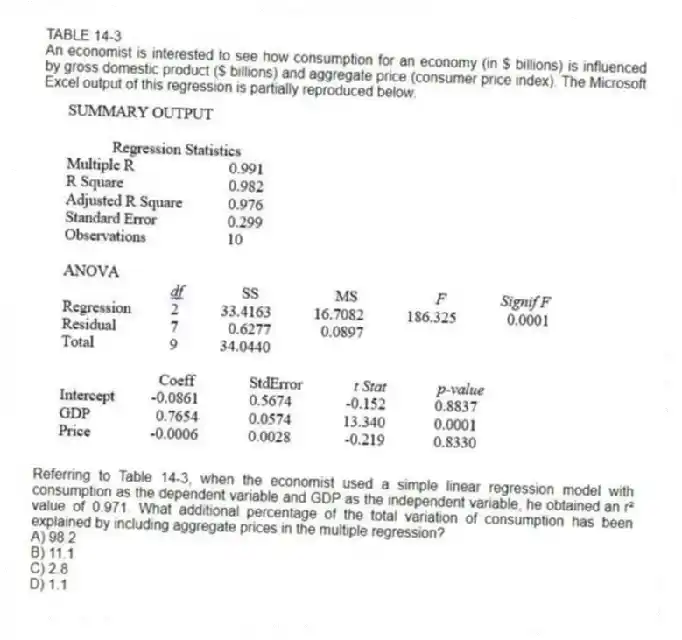
An economist is interested to see how consumption for an economy (in $ billions) is influenced by gross domestic product ($ billions) and aggregate price (consumer price index) . The Microsoft Excel output of this regression is partially reproduced below. 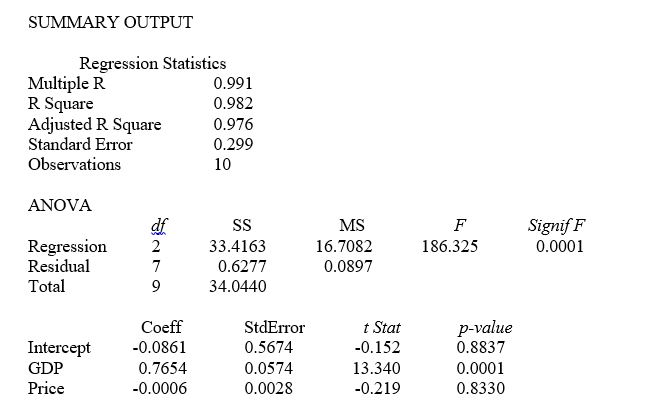
-Referring to Table 14-3, when the economist used a simple linear regression model with consumption as the dependent variable and GDP as the independent variable, he obtained an r² value of 0.971. What additional percentage of the total variation of consumption has been explained by including aggregate prices in the multiple regression?
A) 98.2
B) 11.1
C) 2.8
D) 1.1
Correct Answer:
Verified
Q2: TABLE 14-1
A manager of a product sales
Q4: TABLE 14-2
A professor of industrial relations believes
Q4: The variation attributable to factors other than
Q5: TABLE 14-3
An economist is interested to see
Q6: TABLE 14-2
A professor of industrial relations believes
Q8: In a multiple regression problem involving two
Q9: TABLE 14-2
A professor of industrial relations believes
Q10: TABLE 14-3
An economist is interested to see
Q11: TABLE 14-3
An economist is interested to see
Q12: TABLE 14-1
A manager of a product sales
Unlock this Answer For Free Now!
View this answer and more for free by performing one of the following actions

Scan the QR code to install the App and get 2 free unlocks

Unlock quizzes for free by uploading documents