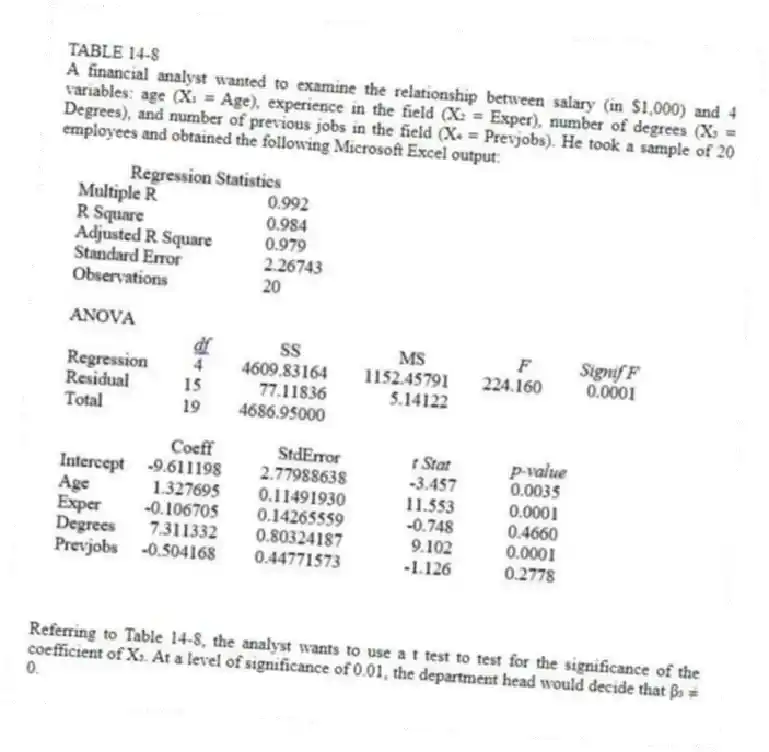
TABLE 14-8
A financial analyst wanted to examine the relationship between salary (in $1,000) and 4 variables: age (X₁ = Age), experience in the field (X₂ = Exper), number of degrees (X₃ = Degrees), and number of previous jobs in the field (X₄ = Prevjobs). He took a sample of 20 employees and obtained the following Microsoft Excel output: 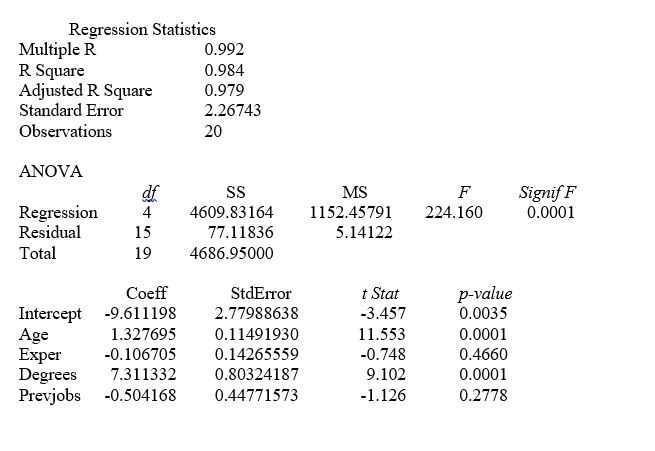
-Referring to Table 14-8, the analyst wants to use a t test to test for the significance of the coefficient of X₃. At a level of significance of 0.01, the department head would decide that β₃ ≠ 0.
Correct Answer:
Verified
Q122: TABLE 14-9
You decide to predict gasoline prices
Q123: TABLE 14-9
You decide to predict gasoline prices
Q124: TABLE 14-10
You worked as an intern at
Q125: TABLE 14-10
You worked as an intern at
Q126: TABLE 14-10
You worked as an intern at
Q128: TABLE 14-8
A financial analyst wanted to examine
Q129: TABLE 14-8
A financial analyst wanted to examine
Q130: TABLE 14-10
You worked as an intern at
Q131: TABLE 14-10
You worked as an intern at
Q132: TABLE 14-9
You decide to predict gasoline prices
Unlock this Answer For Free Now!
View this answer and more for free by performing one of the following actions

Scan the QR code to install the App and get 2 free unlocks

Unlock quizzes for free by uploading documents