TABLE 16-13
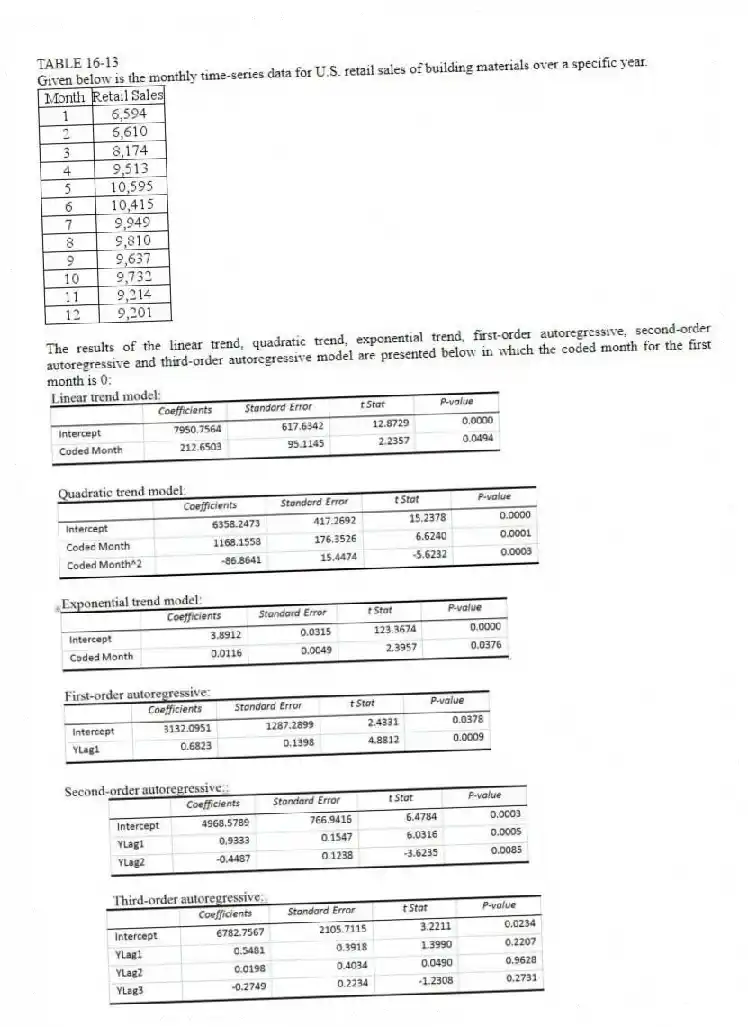
Given below is the monthly time-series data for U.S. retail sales of building materials over a specific year.

The results of the linear trend, quadratic trend, exponential trend, first-order autoregressive, second-order autoregressive and third-order autoregressive model are presented below in which the coded month for the first month is 0:


-Referring to Table 16-13, you can conclude that the second-order autoregressive model is appropriate at the 5% level of significance.
Correct Answer:
Verified
Q149: TABLE 16-13
Given below is the monthly time-series
Q150: TABLE 16-13
Given below is the monthly time-series
Q151: TABLE 16-13
Given below is the monthly time-series
Q152: TABLE 16-13
Given below is the monthly time-series
Q153: TABLE 16-13
Given below is the monthly time-series
Q155: TABLE 16-13
Given below is the monthly time-series
Q156: TABLE 16-13
Given below is the monthly time-series
Q157: TABLE 16-13
Given below is the monthly time-series
Q158: TABLE 16-13
Given below is the monthly time-series
Q159: TABLE 16-13
Given below is the monthly time-series
Unlock this Answer For Free Now!
View this answer and more for free by performing one of the following actions

Scan the QR code to install the App and get 2 free unlocks

Unlock quizzes for free by uploading documents