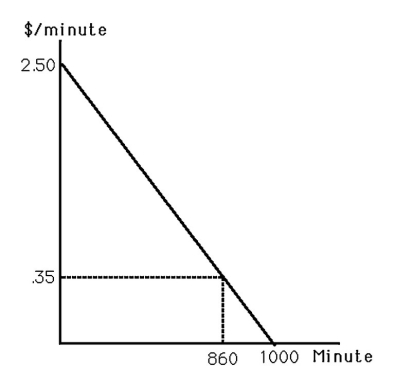
-The above figure shows the market demand curve for mobile telecommunications (time spent on a mobile phone) . If the price were zero, consumer surplus would equal
A) $301.00.
B) $924.50.
C) $1,225.50.
D) $1,250.00.
Correct Answer:
Verified
Q5: Mister Jones was selling his house.The asking
Q33: Mary purchased a stuffed animal toy for
Q58: Producer surplus is equal to
A) the area
Q62: In the long run, firms in a
Q63: Currently, when a consumer purchases a "green"
Q64: Market consumer surplus
A)is the area under the
Q65: With identical firms, constant input prices, and
Q66: If a market is NOT perfectly competitive,
Unlock this Answer For Free Now!
View this answer and more for free by performing one of the following actions

Scan the QR code to install the App and get 2 free unlocks

Unlock quizzes for free by uploading documents