Multiple Choice

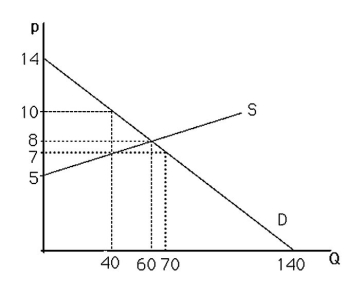
-The above figure shows a graph of a market for pizzas in a large town.At a price of $10,the market
A) is not in equilibrium.
B) has excess supply.
C) does not have excess demand.
D) All of the above.
Correct Answer:
Verified
Related Questions

