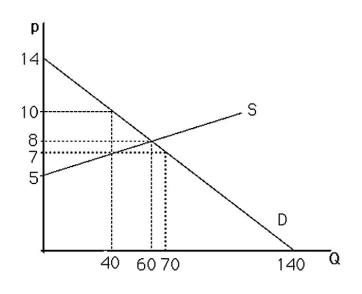
-The above figure shows a graph of the market for pizzas in a large town.Suppose that concern over dietary habits has led the government to impose a restriction that limits suppliers to produce only 40 pizzas.As a result,for prices greater than $7,the
A) supply curve is unchanged.
B) supply curve is vertical.
C) demand curve becomes vertical.
D) demand curve becomes horizontal.
Correct Answer:
Verified
Q126: Considering that the U.S.places a quota on
Q127: Consumer groups tend to lobby for
A) price
Q128: Agricultural price supports are
A) floors.
B) ceilings.
C) quantity
Q129: A price restriction that tells suppliers the
Q130: Suppose the market for a good is
Q132: Suppose the market for potatoes can be
Q133: Producer groups tend to lobby for
A) price
Q134: The fact that many people drive faster
Q135: Assume that the market for annual physical
Q136: Suppose that government decides to create a
Unlock this Answer For Free Now!
View this answer and more for free by performing one of the following actions

Scan the QR code to install the App and get 2 free unlocks

Unlock quizzes for free by uploading documents