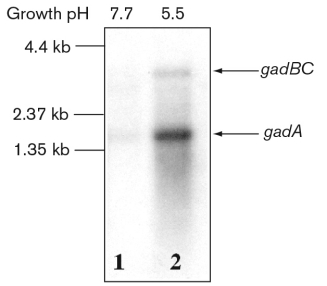
Observe the figure below and discuss how a single northern blot can reveal differences in size and abundance of the E. coli acid-resistance gene gadA with respect to the gadBC operon and the inducible expression of these genes at low pH.

Correct Answer:
Verified
View Answer
Unlock this answer now
Get Access to more Verified Answers free of charge
Q62: Briefly explain how real-time polymerase chain reaction
Q63: What is synthetic biology? Provide an example
Q64: What is the principle of the electrophoretic
Q65: How can a protein be detected on
Q66: What is the conceptual basis of the
Q67: The figure below depicts a "kill switch"
Q68: How is the concept of "logic gates"
Q69: Explain the principle of riboswitches and switchboards,
Q71: Describe the whole-genome DNA-binding analysis using ChIP-on-chip
Q72: Describe the use of a primary and
Unlock this Answer For Free Now!
View this answer and more for free by performing one of the following actions

Scan the QR code to install the App and get 2 free unlocks

Unlock quizzes for free by uploading documents