Multiple Choice
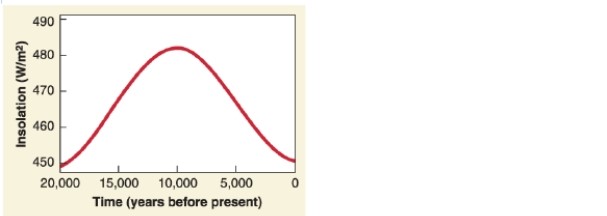
-Referring to the figure, what does the graph show?
A) wind speed
B) solar intensity
C) sand dune migration
D) rainfall history
Correct Answer:
Verified
Related Questions
Q121: How are people causing many large desert
Q122: Etching the desert floor to make the
Q123: Q124: Regs composed of lag deposits and regs Q125: The Sahara became wetter during the Green Q127: Due to water diversions, the Aral Sea Q128: What do you think would happen to![]()
Unlock this Answer For Free Now!
View this answer and more for free by performing one of the following actions

Scan the QR code to install the App and get 2 free unlocks

Unlock quizzes for free by uploading documents