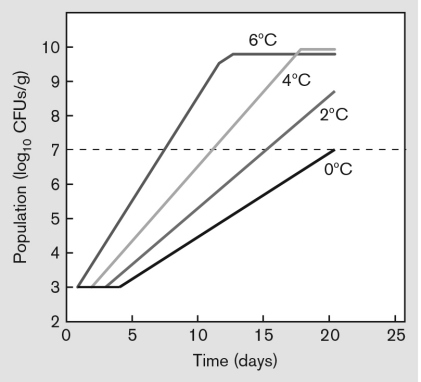
The graph below shows an experiment in which growth of aerobic bacteria in ground beef (CFUs/g) was measured at different refrigeration temperatures. Interpret the graph and explain what the dotted line represents.
Correct Answer:
Verified
View Answer
Unlock this answer now
Get Access to more Verified Answers free of charge
Q60: Bacteria generally can't be eaten as isolated
Q61: Why is Agrobacterium used in genetic engineering
Q62: Describe the primary and secondary fermentations involved
Q63: Describe several physical means of food preservation.
Q64: Explain the difference between food spoilage and
Q66: Describe some of the characteristics that industrial
Q67: In the figure below, identify the carbohydrate
Q68: With respect to an industrial process, what
Q69: The figure below represents microbial growth (CFUs/mL)
Q70: What makes a company dealing with industrial
Unlock this Answer For Free Now!
View this answer and more for free by performing one of the following actions

Scan the QR code to install the App and get 2 free unlocks

Unlock quizzes for free by uploading documents