What can be interpreted from the following graph? 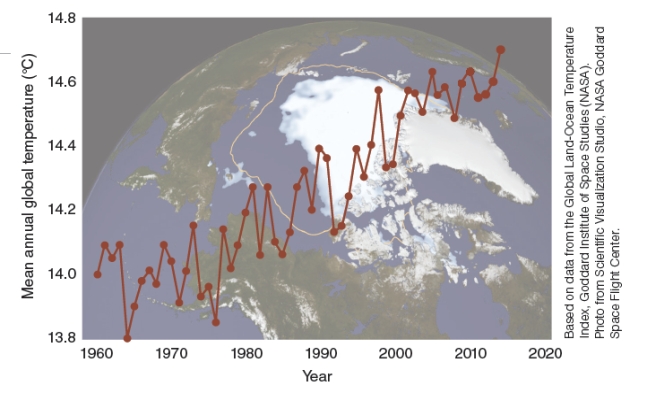 1. The graph shows that the Earth's surface temperatures do naturally fluctuate. 2. The graph shows that there has been a warming trend in the last several decades.
A) 1 only
B) 2 only
C) 1&2
D) None of these choices
Correct Answer:
Verified
Q1: What is the fate of solar radiation
Q2: What is a rain shadow?
A)The silhouette of
Q4: Human activities have increased the levels of
Q5: The amount of water vapor in the
Q6: In science the terms climate and weather
Q7: Which is true for solar radiation?
A)It powers
Q8: Which of the following greenhouse gases has
Q9: _ is typical weather patterns that occur
Q10: The graph below shows atmospheric concentration of
Q11: Of the various factors that determine an
Unlock this Answer For Free Now!
View this answer and more for free by performing one of the following actions

Scan the QR code to install the App and get 2 free unlocks

Unlock quizzes for free by uploading documents