Look at the different emission levels in the bar graph below. What BEST accounts for these differences in emissions? 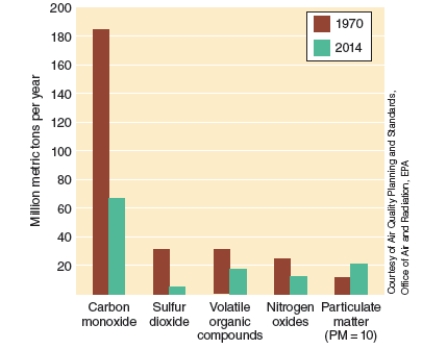
A) The Clean Air Act of 1970 along with the updates and amendments of 1977 and 1990
B) The use of electrostatic precipitators in coal burning power plants
C) The development of "superclean" cars that do not emit any nitrogen oxides and hydrocarbons.
D) The use of lead free and cleaner-burning gasoline.
Correct Answer:
Verified
Q42: Despite the increasing percentage of newer automobile
Q43: Urban heat islands affect local air current
Q44: What has been the major success of
Q45: Comparing the two images below -- the
Q46: Long-term exposure to which of the following
Q48: Smaller cars, removal of sulfur from coal,
Q49: Photochemical smog is a brownish orange haze
Q50: _ are domes of heated air that
Q51: The _ authorizes the EPA to establish
Q52: Electrostatic precipitators use electrical charges to attract
Unlock this Answer For Free Now!
View this answer and more for free by performing one of the following actions

Scan the QR code to install the App and get 2 free unlocks

Unlock quizzes for free by uploading documents