What can be interpreted from the figure below about the lifetime probability of death by selected causes? 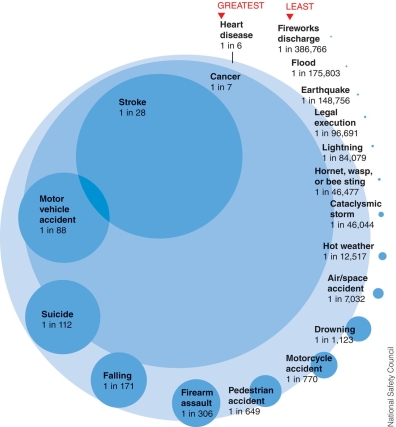
A) The top three causes of death are caused by risks that are controlled by genetics as well as by lifestyle or environment.
B) There is a greater risk of death in flying in an airplane than driving a car.
C) All the top five causes of death are caused purely by stochastic (random) events and cannot be changed by behavior.
D) All of these causes of death are risks that are solely controlled by environment.
Correct Answer:
Verified
Q15: The process of identifying, assessing, and reducing
Q16: A toxicologist is most likely to study
Q17: Risk assessment involves all of the following
Q18: How might the clearing of roads and
Q19: What can be interpreted from the graph
Q21: What phenomenon is illustrated by the diagram
Q22: Infectious organisms include bacteria, viruses, protozoa, and
Q23: A chemical substance that is extremely stable
Q24: Which of the following characteristics caused DDT
Q25: Acute toxicity:
A)is only caused by synthetic chemicals.
B)is
Unlock this Answer For Free Now!
View this answer and more for free by performing one of the following actions

Scan the QR code to install the App and get 2 free unlocks

Unlock quizzes for free by uploading documents