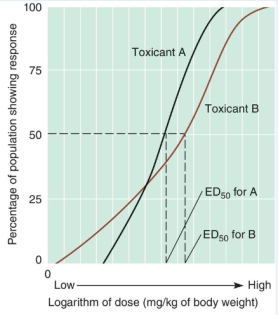
What can be inferred from the graph below? 
A) The biological response for both toxicants increases as the dose is increased.
B) For both toxicants, a harmful response occurs only above a certain threshold level, that is different for each toxicant.
C) Toxicant A has a lower effective dose-50 percent (ED50) than toxicant B.
D) All of the above can be inferred from the graph.
Correct Answer:
Verified
Q44: A carcinogen is a:
A)type of microorganism associated
Q45: We measure toxicity by the dose at
Q46: Endocrine disrupters:
A)are only active in very large
Q47: The _ and _ were amended in
Q48: A dose-response curve shows:
A)the dose of a
Q50: Which of the following statements about dose-response
Q51: DDT was sprayed in a Long Island
Q52: Which of the following is an endocrine
Q53: Which POP is still produced and used
Q54: The _ is the type and amount
Unlock this Answer For Free Now!
View this answer and more for free by performing one of the following actions

Scan the QR code to install the App and get 2 free unlocks

Unlock quizzes for free by uploading documents