According to the graph below: 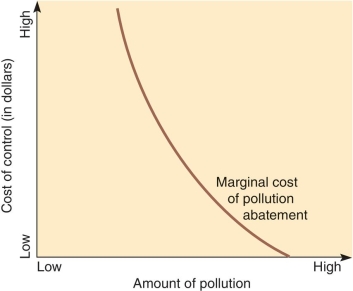
A) As more and more pollution is eliminated from the environment, the cost of removing each additional unit of pollution decreases.
B) As more and more pollution is eliminated from the environment, the cost of removing each additional unit of pollution increases.
C) Cost of pollution removal is constant regardless of how polluted an area is.
D) Cost of pollution is relative to the type of pollution
Correct Answer:
Verified
Q43: Identify three individuals that have made a
Q53: The role of the Council on Environmental
Q54: Economics depend on the _ for raw
Q55: The added cost of an additional unit
Unlock this Answer For Free Now!
View this answer and more for free by performing one of the following actions

Scan the QR code to install the App and get 2 free unlocks

Unlock quizzes for free by uploading documents