According to the graph below, the world population reached 7 billion around what year? 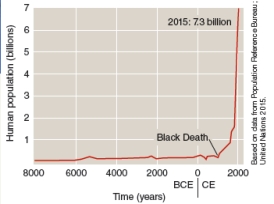
A) 1900 CE
B) 2015 BCE
C) 2015 CE
D) Around the time of the Black Death
Correct Answer:
Verified
Q3: Which of the following statements associated with
Q4: Which of the following describes the relationship
Q5: Which of the following describes a highly
Q6: Trees, fishes, fertile agriculture soil are examples
Q7: The photograph below represents the average family
Q9: To improve their economic conditions, many LDCs
Q10: The global fertility rate is currently 1.2
Q11: 86% of the global resource consumption of
Q12: Approximately _ percentage of the world's population
Q13: Which of the following represents consumption overpopulation?
Unlock this Answer For Free Now!
View this answer and more for free by performing one of the following actions

Scan the QR code to install the App and get 2 free unlocks

Unlock quizzes for free by uploading documents