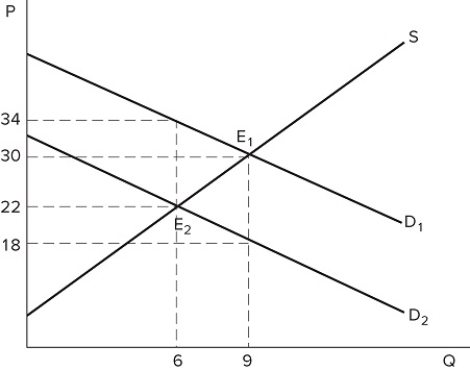
The graph shown demonstrates a tax on buyers. After the tax has been imposed, sellers produce _______ units, and the post-tax price received for each one sold is _______.
A) 6; $22 B) 6; $34 C) 9; $18 D) 9; $30
Correct Answer:
Verified
Unlock this answer now Get Access to more Verified Answers free of charge
 The graph shown demonstrates a tax on buyers. After the tax has been imposed, sellers produce _______ units, and the post-tax price received for each one sold is _______.
