Multiple Choice
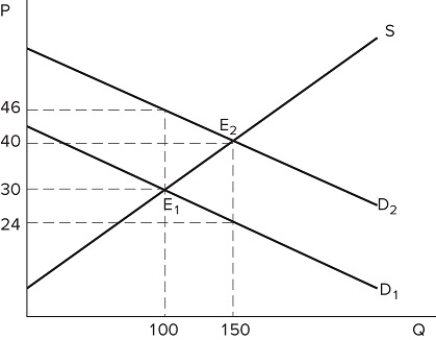 The graph shown best represents:
A) a tax on sellers.
B) a subsidy to sellers.
C) a price floor.
D) a subsidy to buyers.
Correct Answer:
Verified
Related Questions
The graph shown best represents:
A) a tax on sellers.
B) a subsidy to sellers.
C) a price floor.
D) a subsidy to buyers.
Correct Answer:
Verified

