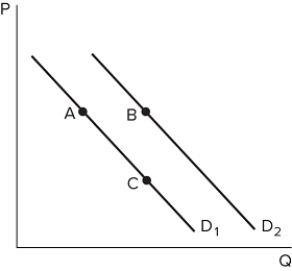
 Suppose the graph shown depicts the demand for a normal good. A shift from A to B might be caused by:
A) an increase in price.
B) a decrease in price.
C) an increase in income.
D) a decrease in income.
Correct Answer:
Verified
Q61: With the baby boomer generation hitting the
Q63: Suppose the demand for socks has decreased.
Q66: Ray's company just announced that all employees
Q70: A decrease in the price of spaghetti
Q72: As part of recent cutbacks at his
Q75: Suppose the price of house paint, a
Q76: Yang just got a big promotion at
Q77: A change in a non-price factor of
Q78: An increase in the price of ice
Q80: What happens to the demand curve when
Unlock this Answer For Free Now!
View this answer and more for free by performing one of the following actions

Scan the QR code to install the App and get 2 free unlocks

Unlock quizzes for free by uploading documents