Multiple Choice
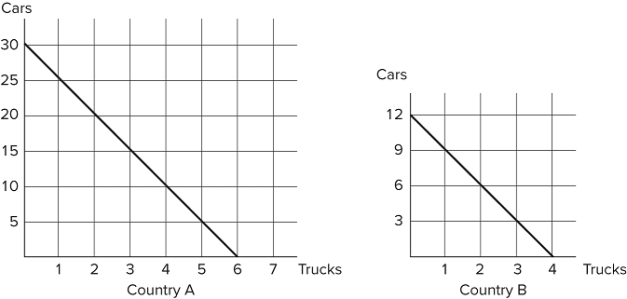 Refer to the figure shown, which represents the production possibilities frontiers (PPFs) for Countries A and B. The slope of Country A's PPF is _____ and the slope of Country B's PPF is _____.
A) −5; −3
B) −30; −3
C) −1/5; −1/3
D) 1/5; 1/3
Correct Answer:
Verified
Related Questions
Q26: When nations trade:
A) only the strongest nation
Q33: An increase in productivity as a result
Unlock this Answer For Free Now!
View this answer and more for free by performing one of the following actions

Scan the QR code to install the App and get 2 free unlocks

Unlock quizzes for free by uploading documents