The graph shown displays the Lorenz curves for three societies: A, B, and C. 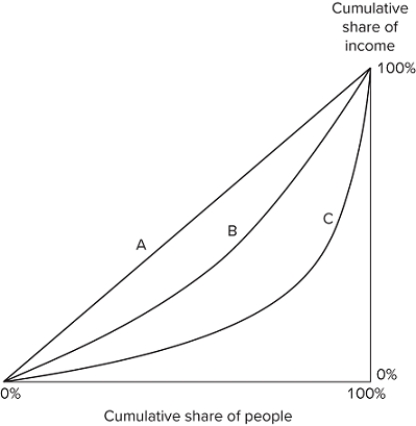 Which of the following statements is true? The Gini coefficient in Society A is zero.Inequality in Society A is lower than in Society B or C.The Gini coefficient is highest in Society C.
A) I only
B) II and III
C) III only
D) I, II, and III
Correct Answer:
Verified
Q67: The graph shown displays a Lorenz curve.
Q68: The graph shown displays a Lorenz curve.
Q69: The global pattern of inequality has:
A)remained surprisingly
Q70: The Gini coefficient is calculated by measuring
Q71: A perfectly straight Lorenz curve would indicate
Q73: Which graph summarizes inequality visually?
A)Laffer curve
B)Income inequality
Q74: Perfect income equality means everyone in a
Q75: The graph shown displays the Lorenz curve
Q76: The _ the Lorenz curve lies from
Q77: In the United States, the top 20
Unlock this Answer For Free Now!
View this answer and more for free by performing one of the following actions

Scan the QR code to install the App and get 2 free unlocks

Unlock quizzes for free by uploading documents