The graph shown depicts a tax being imposed, causing demand to shift from D1 to D2. 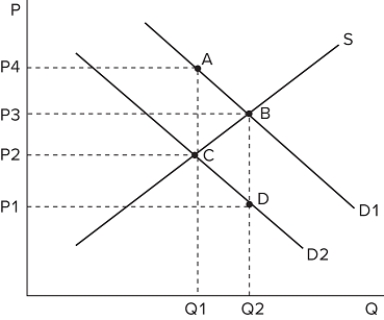 What change does this tax cause?
A) Positive government revenue and decreased consumption
B) Zero government revenue and decreased consumption
C) A transfer of revenue to surplus and increased consumption
D) Positive government revenue and increased consumption
Correct Answer:
Verified
Q8: One of the primary aims of taxation
Q9: The primary intent of a tax on
Q10: Which of the following is not an
Q11: One reason governments impose taxes is to:
A)raise
Q12: A tax will sometimes alter consumers' incentives.
Q14: Taxes change behavior in which of the
Q15: Which of the following is an example
Q16: A tax on which of the following
Q17: The graph shown depicts a tax being
Q18: In deciding which programs the government should
Unlock this Answer For Free Now!
View this answer and more for free by performing one of the following actions

Scan the QR code to install the App and get 2 free unlocks

Unlock quizzes for free by uploading documents