The graph shown depicts a tax being imposed, causing demand to shift from D1 to D2. 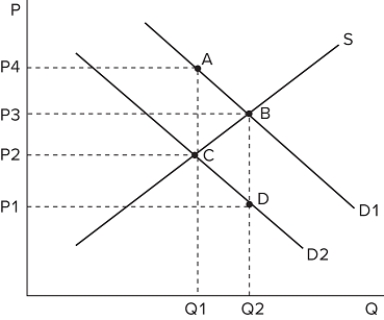 The amount of the tax imposed is equal to:
A) (P1 − P3) .
B) (P2 − P1) .
C) (P4 − P2) .
D) (P4 − P3) .
Correct Answer:
Verified
Q2: When evaluating the costs and benefits of
Q3: Which of the following is an example
Q4: When a tax is present in a
Q5: The graph shown depicts a tax being
Q6: A tax on which of the following
Q8: One of the primary aims of taxation
Q9: The primary intent of a tax on
Q10: Which of the following is not an
Q11: One reason governments impose taxes is to:
A)raise
Q12: A tax will sometimes alter consumers' incentives.
Unlock this Answer For Free Now!
View this answer and more for free by performing one of the following actions

Scan the QR code to install the App and get 2 free unlocks

Unlock quizzes for free by uploading documents