The graph shown depicts a tax being imposed, causing demand to shift from D1 to D2. 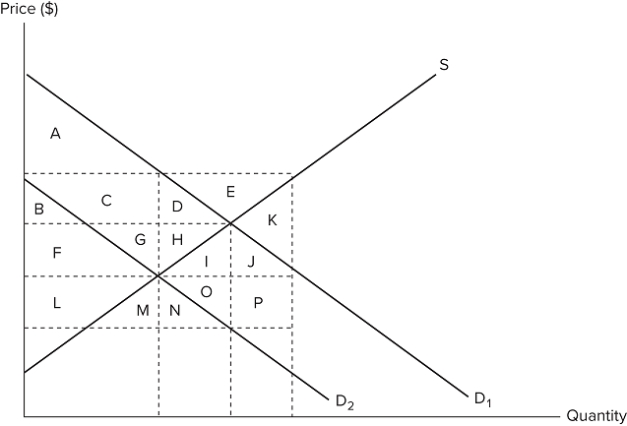 Which areas of the graph represent the amount of revenue that is generated by the tax?
A) B + C + F + G
B) F + G + H + I + L + M + N + O
C) B + C + F + G + L + M
D) B + C + D + E + F + G + H + I + J + K + L + M + N + O + P
Correct Answer:
Verified
Q15: Which of the following is an example
Q16: A tax on which of the following
Q17: The graph shown depicts a tax being
Q18: In deciding which programs the government should
Q19: One cost associated with the imposition of
Q21: The effort used to collect and manage
Q22: Considering a given increase in price due
Q23: When a tax is imposed, the surplus
Q24: When a tax is imposed, some of
Q25: Deadweight loss as a result of taxation
Unlock this Answer For Free Now!
View this answer and more for free by performing one of the following actions

Scan the QR code to install the App and get 2 free unlocks

Unlock quizzes for free by uploading documents