The graph shown depicts a tax being imposed, causing demand to shift from D1 to D2. 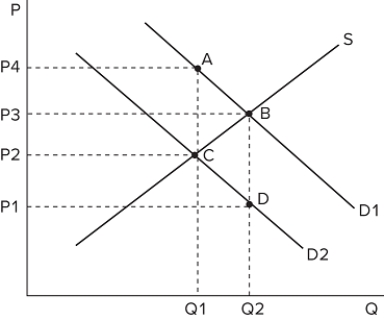 Which area of the graph represents the deadweight loss associated with the tax?
A) CBD
B) ABC
C) ABCD
D) P1DCP2
Correct Answer:
Verified
Q34: Part of the surplus lost to market
Q35: A lump-sum tax:
A)charges the same amount to
Q36: Considering a given increase in price due
Q37: When a tax is imposed and some
Q38: A tax imposed in an otherwise efficient
Q40: One cost associated with the imposition of
Q41: The administrative burden of taxes:
A)is smallest with
Q42: All taxes carry the cost of time
Q43: A lump-sum tax is also known as
Q44: In general, more efficient taxes have:
A)lower administrative
Unlock this Answer For Free Now!
View this answer and more for free by performing one of the following actions

Scan the QR code to install the App and get 2 free unlocks

Unlock quizzes for free by uploading documents