The graph shown displays a market with an externality. 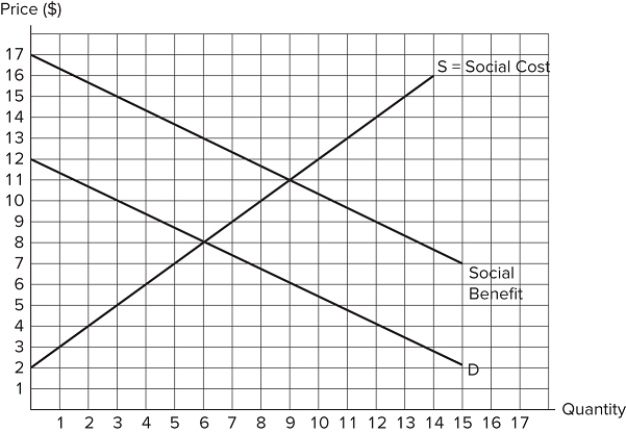 This is a _______ externality, and the optimal quantity is _______ units.
A) positive; 6
B) positive; 8
C) negative; 6
D) negative; 8
Correct Answer:
Verified
Q44: If it is possible to eliminate the
Q45: When a market is fully corrected for
Q46: The graph shown displays a market with
Q47: The graph shown displays a market with
Q48: The net increase to total surplus when
Q50: The graph shown displays a market with
Q51: A market with a positive externality has
Q52: If a company who takes an externality
Q53: When private benefits are less than social
Q54: When private benefits equal social benefits:
A)positive consumption
Unlock this Answer For Free Now!
View this answer and more for free by performing one of the following actions

Scan the QR code to install the App and get 2 free unlocks

Unlock quizzes for free by uploading documents