The graph shown demonstrates the domestic demand and supply for a good, as well as the world price for that good. 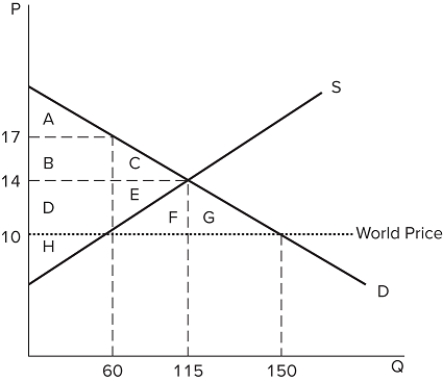 If this economy decides to open to trade, the amount of the good consumed domestically will:
A) increase by 35.
B) increase by 90.
C) decrease by 35.
D) decrease by 90.
Correct Answer:
Verified
Q42: The graph shown demonstrates the domestic demand
Q43: The graph shown demonstrates the domestic demand
Q44: The graph shown demonstrates the domestic demand
Q45: The graph shown demonstrates the domestic demand
Q46: Exports are goods and services that are:
A)produced
Q48: The graph shown demonstrates the domestic demand
Q49: The graph shown demonstrates the domestic demand
Q50: The graph shown demonstrates the domestic demand
Q51: The graph shown demonstrates the domestic demand
Q52: The graph shown demonstrates the domestic demand
Unlock this Answer For Free Now!
View this answer and more for free by performing one of the following actions

Scan the QR code to install the App and get 2 free unlocks

Unlock quizzes for free by uploading documents