The graph shown demonstrates the domestic demand and supply for a good, as well as the world price for that good. 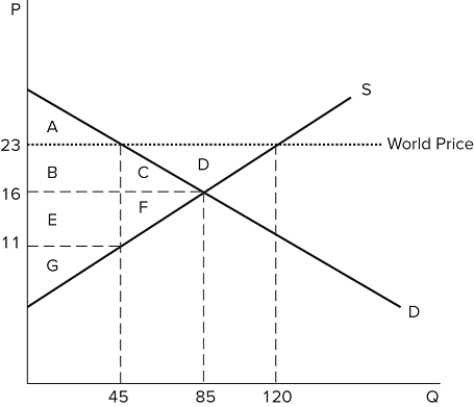 If this economy decides to open to trade, the amount of the good consumed domestically will:
A) increase by 35.
B) increase by 40.
C) decrease by 40.
D) increase by 75.
Correct Answer:
Verified
Q74: The graph shown demonstrates the domestic demand
Q75: The graph shown demonstrates the domestic demand
Q76: The graph shown demonstrates the domestic demand
Q77: The graph shown demonstrates the domestic demand
Q78: The graph shown demonstrates the domestic demand
Q80: The graph shown demonstrates the domestic demand
Q81: The graph shown demonstrates the domestic demand
Q82: Who is likely to be in favor
Q83: A country that produces and consumes a
Q84: The graph shown demonstrates the domestic demand
Unlock this Answer For Free Now!
View this answer and more for free by performing one of the following actions

Scan the QR code to install the App and get 2 free unlocks

Unlock quizzes for free by uploading documents