The graph shown demonstrates the domestic demand and supply for a good, as well as a tariff and the world price for that good. 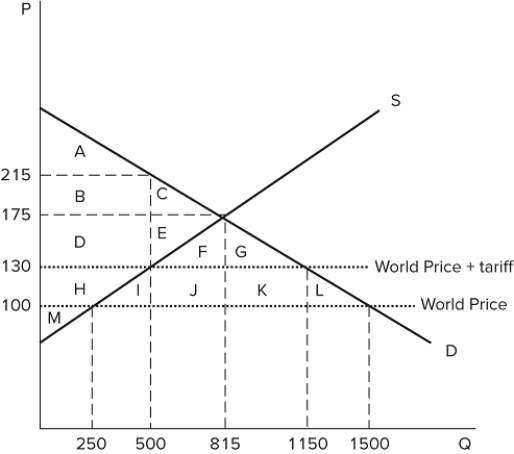 Which area(s) represent the amount of consumer surplus domestic consumers will enjoy after the tariff has been imposed?
A) A
B) A + B + C
C) A + B + C + D + E + F + G
D) A + B + C + D + E + F + G + H + I + J + K + L
Correct Answer:
Verified
Q112: The graph shown demonstrates the domestic demand
Q113: The graph shown demonstrates the domestic demand
Q114: The graph shown demonstrates the domestic demand
Q115: The graph shown demonstrates the domestic demand
Q116: The graph shown demonstrates the domestic demand
Q118: The graph shown demonstrates the domestic demand
Q119: The graph shown demonstrates the domestic demand
Q120: The graph shown demonstrates the domestic demand
Q121: The graph shown demonstrates the domestic demand
Q122: An import quota is:
A)a tax on goods
Unlock this Answer For Free Now!
View this answer and more for free by performing one of the following actions

Scan the QR code to install the App and get 2 free unlocks

Unlock quizzes for free by uploading documents