The graph shown demonstrates the domestic demand and supply for a good, as well as a tariff and the world price for that good. 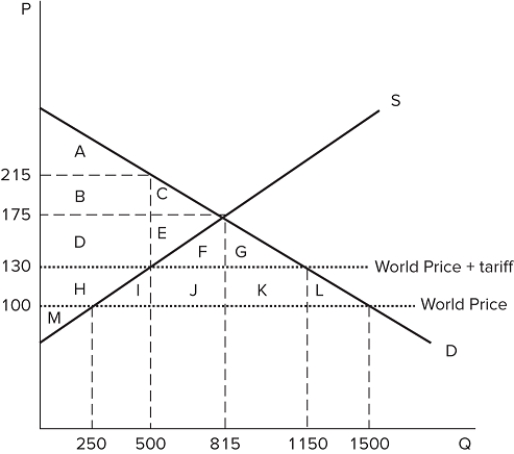 If the economy was originally operating under free trade, after the introduction of the tariff the overall impact on surplus would be a net:
A) gain of areas I + J + K + L.
B) loss of areas I + J + K + L.
C) loss of areas I + L.
D) gain of areas F + G + H + I + J + K + L.
Correct Answer:
Verified
Q104: The graph shown demonstrates the domestic demand
Q105: The graph shown demonstrates the domestic demand
Q106: The graph shown demonstrates the domestic demand
Q107: The graph shown demonstrates the domestic demand
Q108: The graph shown demonstrates the domestic demand
Q110: The graph shown demonstrates the domestic demand
Q111: The graph shown demonstrates the domestic demand
Q112: The graph shown demonstrates the domestic demand
Q113: The graph shown demonstrates the domestic demand
Q114: The graph shown demonstrates the domestic demand
Unlock this Answer For Free Now!
View this answer and more for free by performing one of the following actions

Scan the QR code to install the App and get 2 free unlocks

Unlock quizzes for free by uploading documents