The graph shown demonstrates the domestic demand and supply for a good, as well as a quota and the world price for that good. 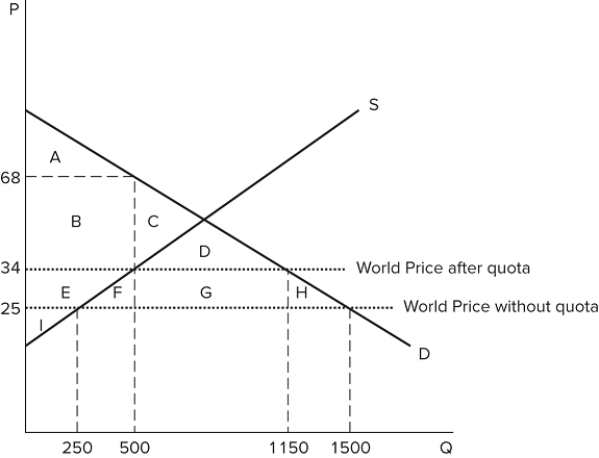 If this economy's government restricts trade, area G will represent:
A) government tax revenues.
B) deadweight loss.
C) quota rents.
D) transferred surplus.
Correct Answer:
Verified
Q125: The graph shown demonstrates the domestic demand
Q126: As a general rule, free trade:
A)increases the
Q127: The graph shown demonstrates the domestic demand
Q128: The graph shown demonstrates the domestic demand
Q129: The graph shown demonstrates the domestic demand
Q131: The graph shown demonstrates the domestic demand
Q132: In general, one of the results of
Q133: The graph shown demonstrates the domestic demand
Q134: The graph shown demonstrates the domestic demand
Q135: The graph shown demonstrates the domestic demand
Unlock this Answer For Free Now!
View this answer and more for free by performing one of the following actions

Scan the QR code to install the App and get 2 free unlocks

Unlock quizzes for free by uploading documents