The graph shown displays the cost and revenue curves associated with a monopolistically competitive firm. 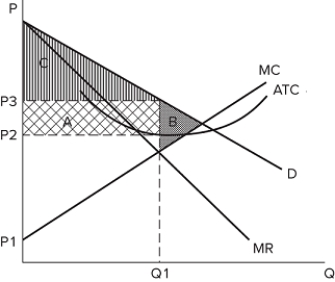 In the graph, area A represents:
A) profits earned in the short and long run.
B) profits earned in the short run.
C) profits earned in the long run.
D) consumer surplus.
Correct Answer:
Verified
Q32: An oligopoly is characterized by the _,
Q33: The graph shown displays the cost and
Q34: The graph shown displays the cost and
Q35: In the short run, product differentiation enables
Q36: Long run economic profits are possible in
Q38: The graph shown displays the cost and
Q39: Product differentiation refers to the practice of:
A)selling
Q40: The graph shown displays the cost and
Q41: If a monopolistically competitive firm is earning
Q42: The demand curve faced by the monopolistically
Unlock this Answer For Free Now!
View this answer and more for free by performing one of the following actions

Scan the QR code to install the App and get 2 free unlocks

Unlock quizzes for free by uploading documents