The graph shown displays the cost and revenue curves associated with a monopolistically competitive firm. 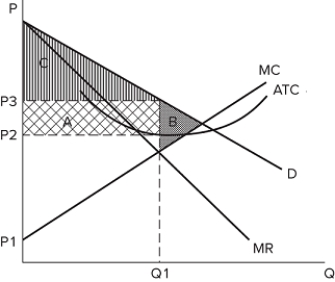 In the graph, area C represents:
A) producer surplus.
B) consumer surplus.
C) deadweight loss.
D) profits.
Correct Answer:
Verified
Q17: Which of the following is one of
Q18: Large barriers to entry exist in which
Q19: Which type of market structure contains many
Q20: A market that has no barriers to
Q21: The graph shown displays the cost and
Q23: Monopolistically competitive firms behave like _ in
Q24: In the long run, monopolistically competitive firms:
Q25: The graph shown displays the cost and
Q26: These are the cost and revenue curves
Q27: Standardized products can appear:
A)only in perfectly competitive
Unlock this Answer For Free Now!
View this answer and more for free by performing one of the following actions

Scan the QR code to install the App and get 2 free unlocks

Unlock quizzes for free by uploading documents