The graph shown displays the marginal cost and marginal revenue curves for a perfectly competitive firm. 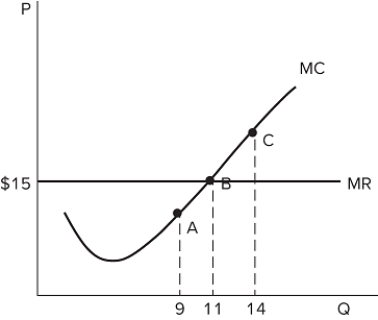 This firm's profits at point A are:
A) higher than those at point B.
B) lower than those at point B.
C) the same as those at point B.
D) higher than those at point C.
Correct Answer:
Verified
Q62: The table shown displays the total costs
Q63: The table shown displays the total costs
Q64: The table shown displays the total costs
Q65: The table shown displays the total costs
Q66: <p><b><b><span style="font-size:20pt;"><span style="color:#FF0000;"> Q68: As long as average revenue remains above Q69: The marginal cost of a firm: Q70: As long as the market price remains Q71: For a firm in a perfectly competitive Q72: The table shown displays the total costs![]()
A)crosses total
Unlock this Answer For Free Now!
View this answer and more for free by performing one of the following actions

Scan the QR code to install the App and get 2 free unlocks

Unlock quizzes for free by uploading documents