The graph shown displays the marginal cost and marginal revenue curves for a perfectly competitive firm. 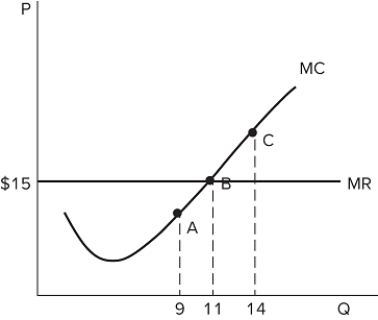 Producing nine units will earn the firm _______ profits than those earned at an output of 11 units, so the firm should _______ production.
A) lower; increase
B) higher; decrease
C) higher; increase
D) lower; decrease
Correct Answer:
Verified
Q56: Firms in perfectly competitive markets who wish
Q57: If a firm in a perfectly competitive
Q58: Firms in perfectly competitive markets who wish
Q59: If a firm in a perfectly competitive
Q60: The table shown displays the total costs
Q62: The table shown displays the total costs
Q63: The table shown displays the total costs
Q64: The table shown displays the total costs
Q65: The table shown displays the total costs
Q66: <p><b><b><span style="font-size:20pt;"><span style="color:#FF0000;"> ![]()
Unlock this Answer For Free Now!
View this answer and more for free by performing one of the following actions

Scan the QR code to install the App and get 2 free unlocks

Unlock quizzes for free by uploading documents